Venue operations

Venue analytics and reporting systems built to make revenue, utilization, and zone performance easier to act on.

Multi-zone venues often generate useful operational data but still rely on spreadsheets, exports, and manually assembled reports. A focused dashboard can turn raw venue data into clearer comparisons, trends, alerts, and management-ready reporting.

Common venue operations problems

Useful performance data exists, but management visibility stays fragmented.

  • Operational data is spread across exports and spreadsheets.
  • Revenue is reviewed without enough zone-level context.
  • Utilization and covers are difficult to compare consistently.
  • Weekly reports are assembled manually.
  • Underperforming zones are identified too late.
  • Operational signals are mixed into raw data instead of surfaced clearly.
  • Management lacks one consistent reporting view.
  • Report settings and retention rules are unclear.
What can be built

Dashboards and reporting workflows shaped around venue operations.

Venue performance dashboardsZone analyticsUtilization reportingRevenue and covers trackingStaff productivity metricsUpload and validation workflowsReport generation and archivesPDF and CSV exportsOperational alerts or signalsManagement dashboardsConfigurable reporting settings

Best fit

Operations teams managing zones, capacity, utilization, and recurring reports.

Event venuesEntertainment venuesClubsPremium loungesMulti-zone hospitality venuesConference facilitiesVenue groupsOperations teams managing floor, zone, or capacity data

Relevant proof

Venue intelligence workflow in practice

Meridian Venue Intelligence Platform

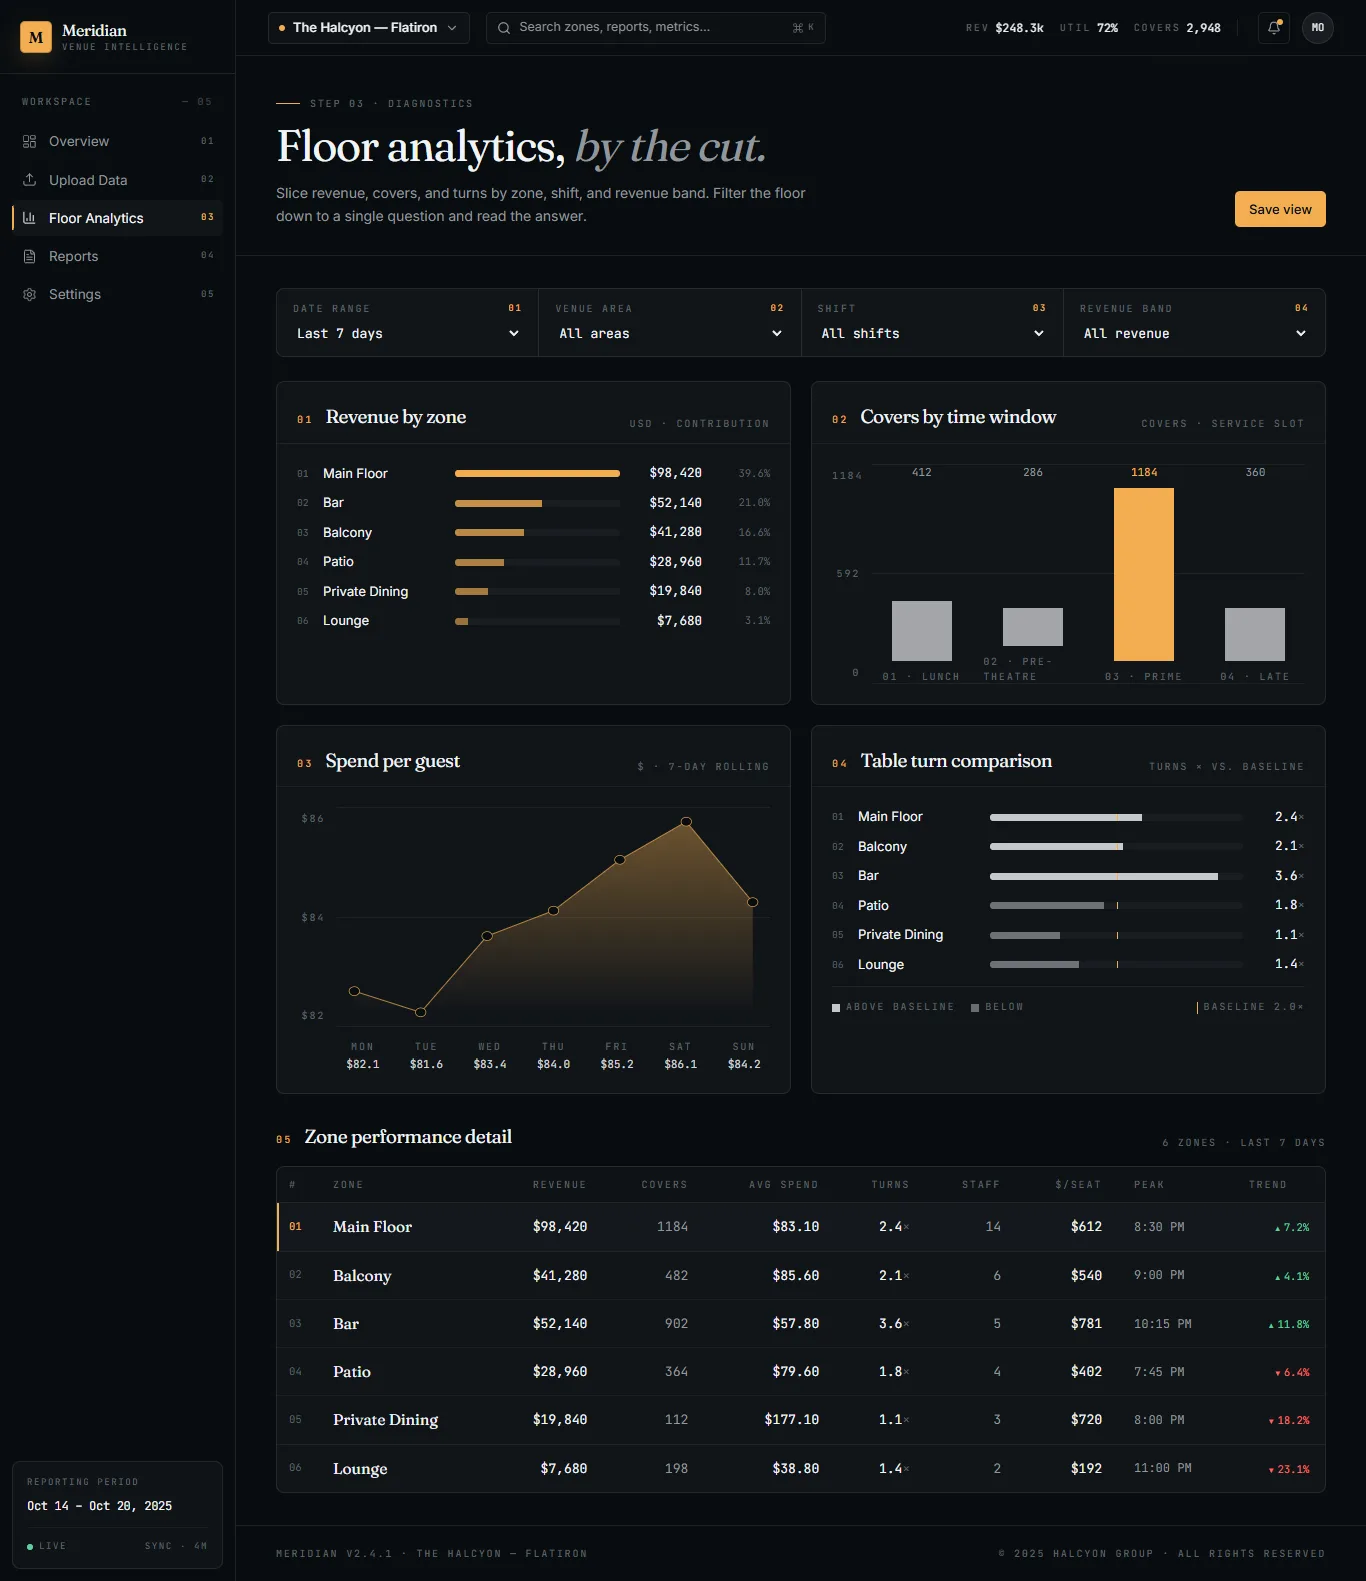
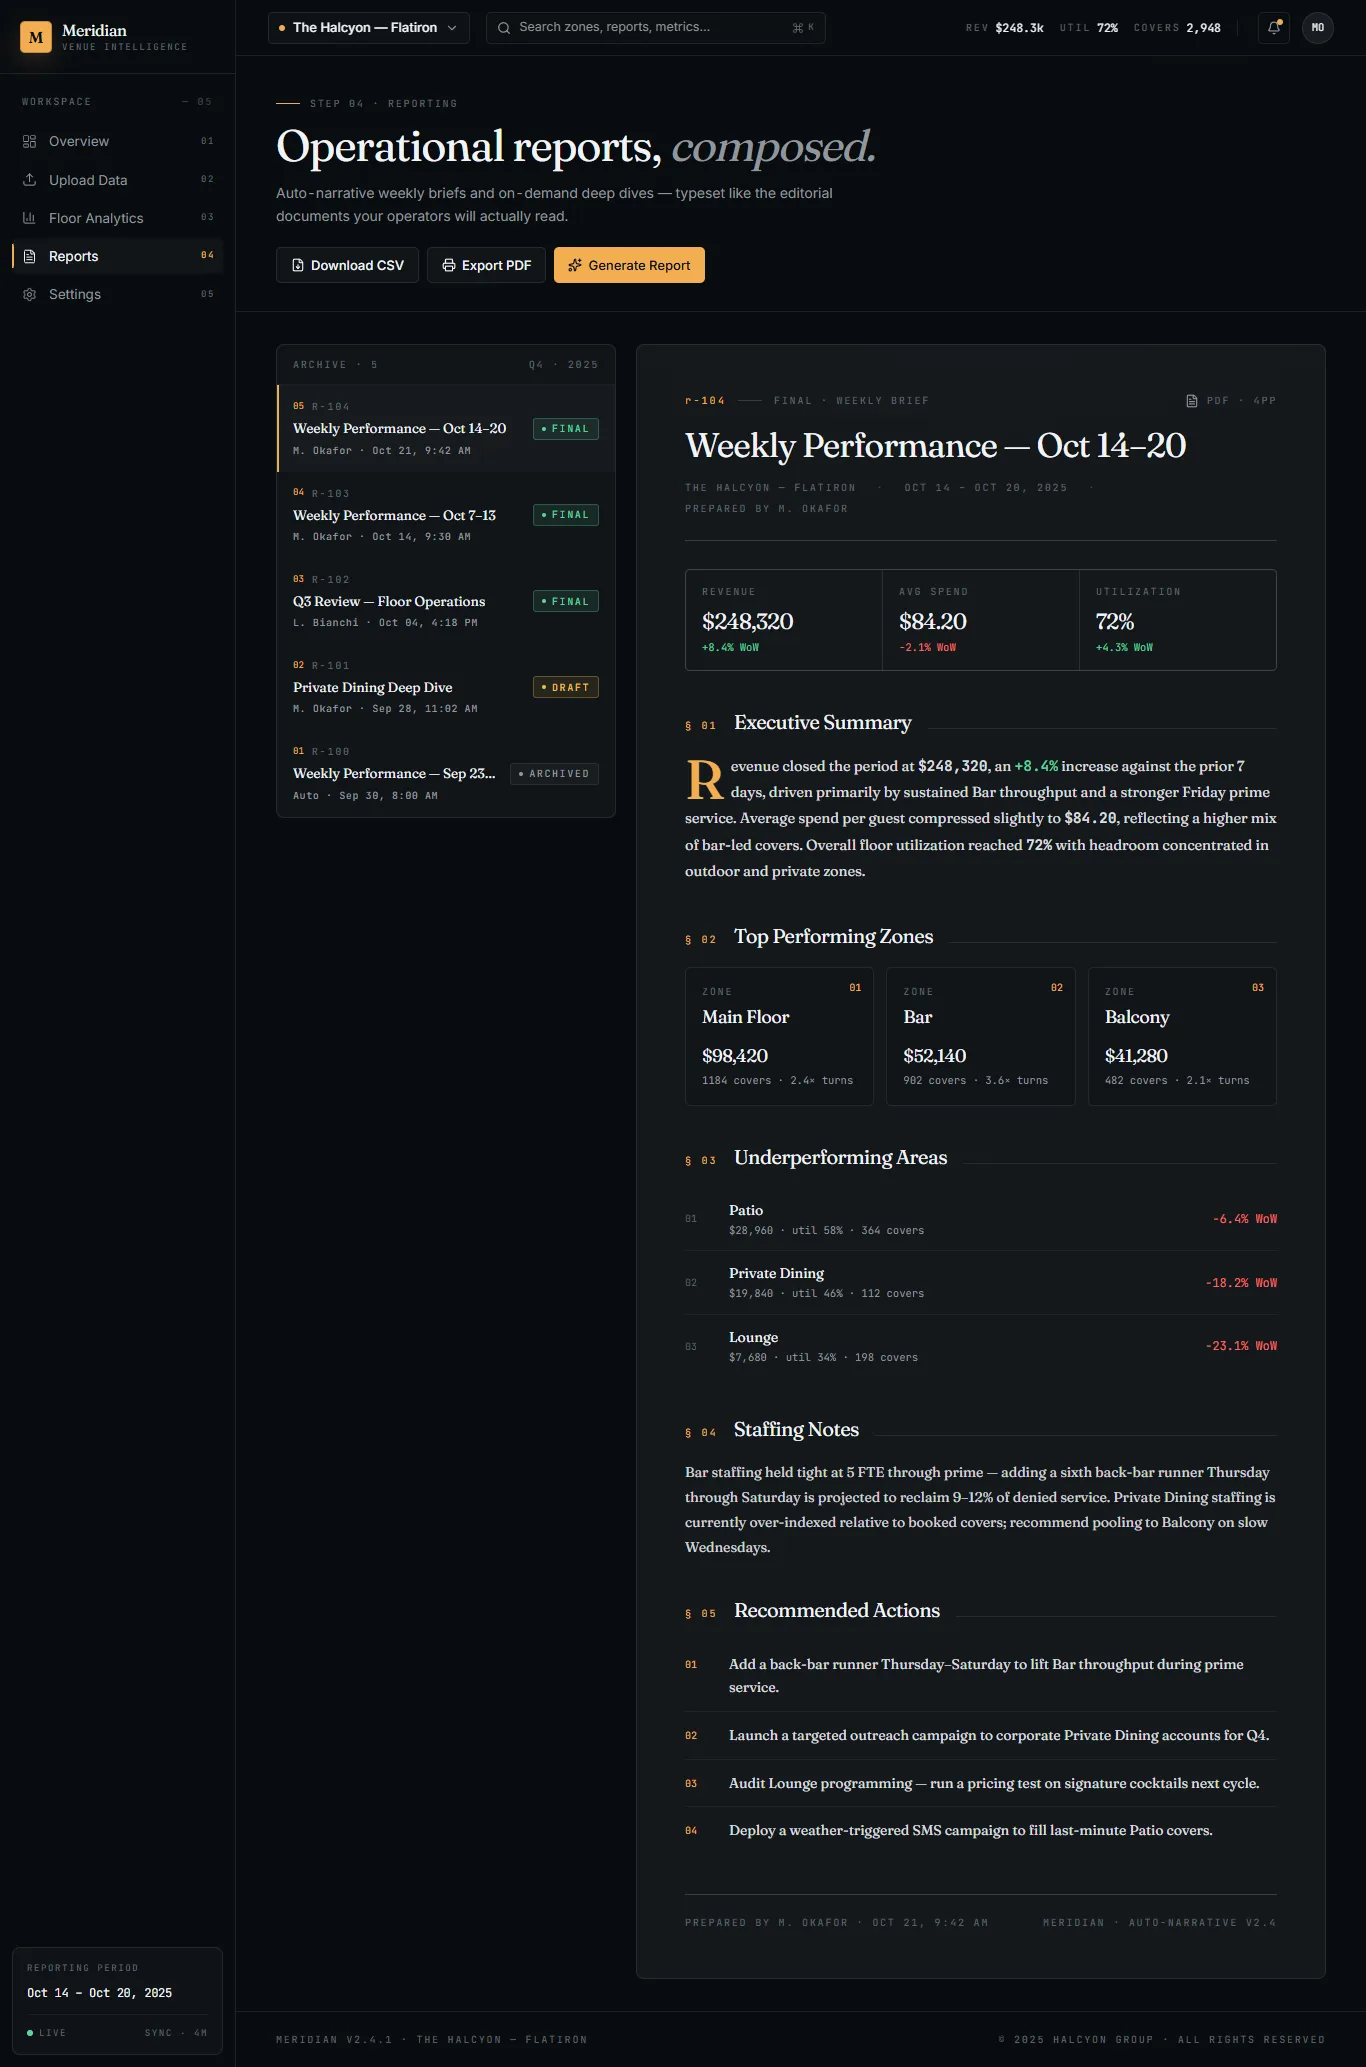
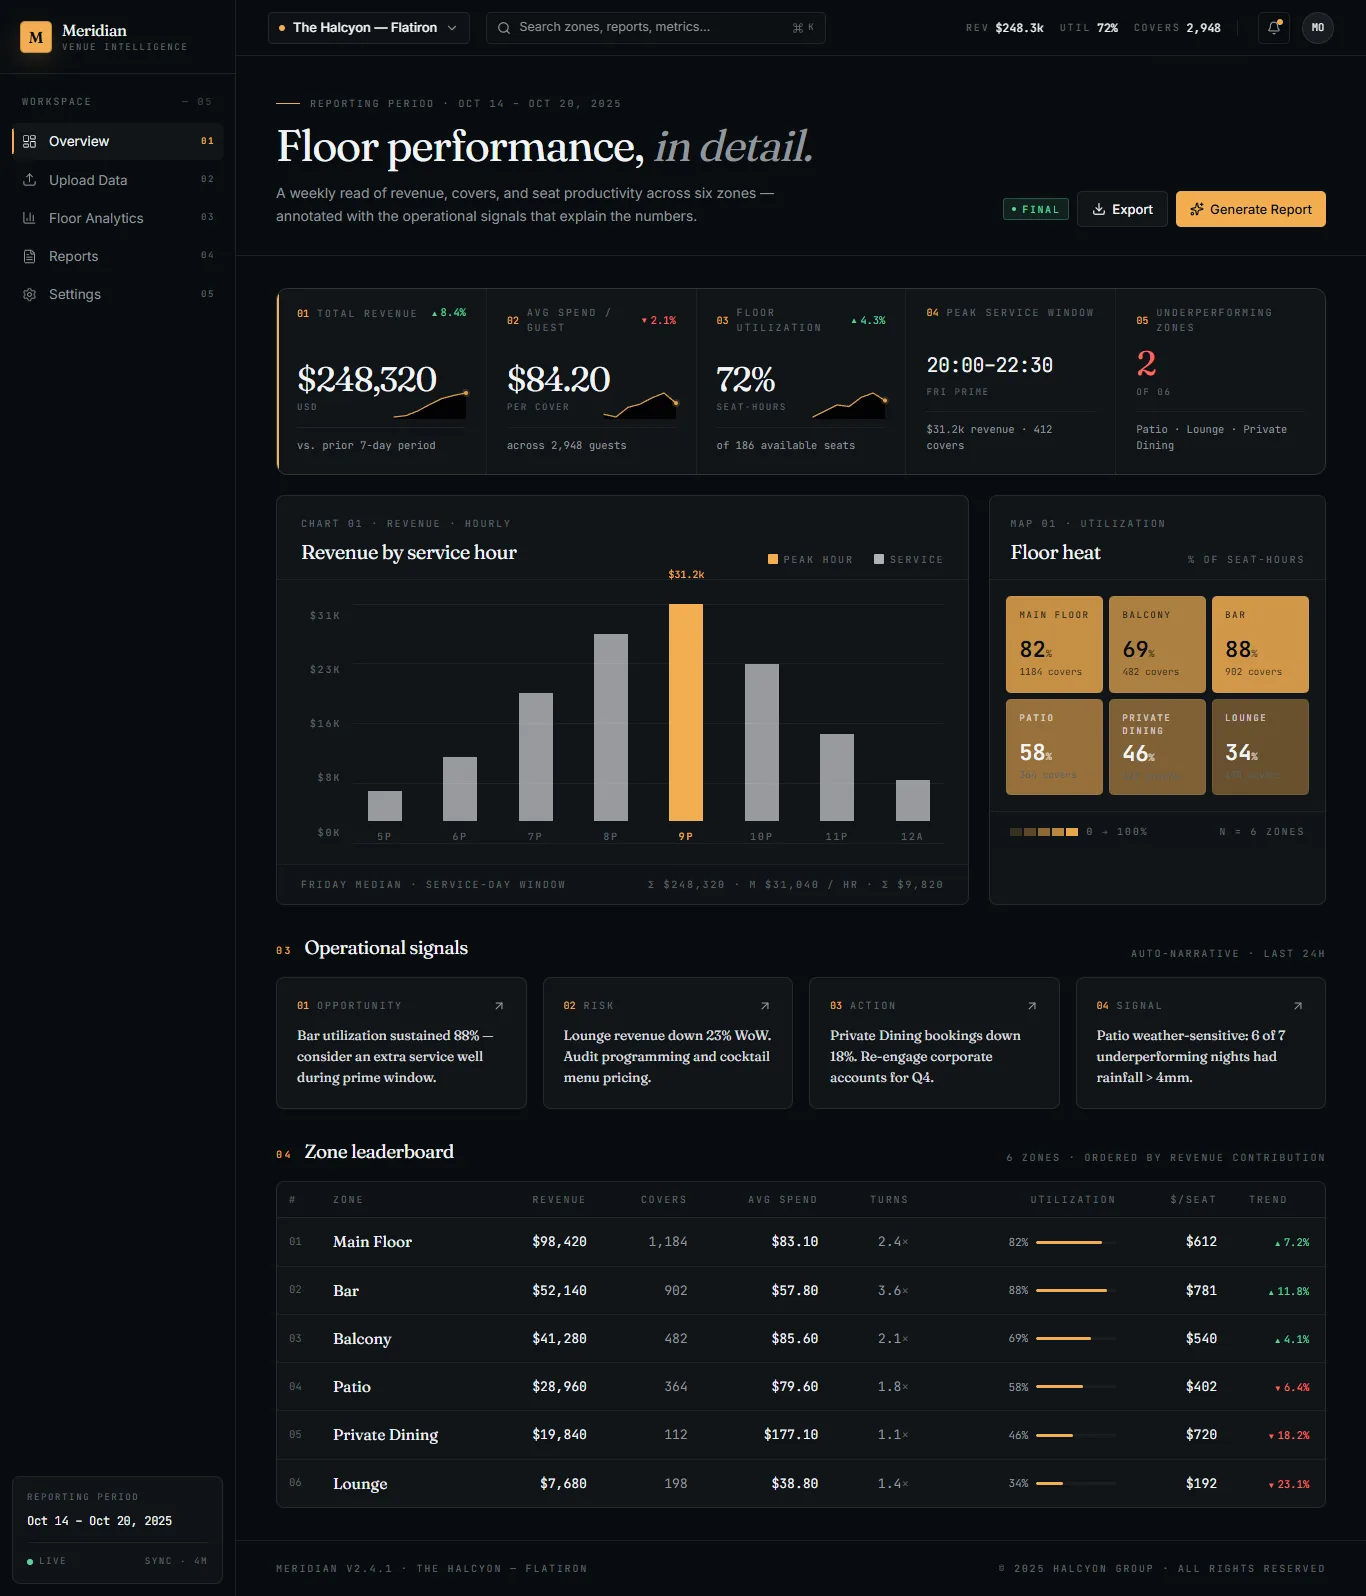
A product-style venue operations dashboard designed to turn uploaded performance data into clearer revenue, utilization, zone, and reporting views.

Read the full Meridian case study

Recommended first phase

Build one dependable reporting cycle before expanding the platform.

Map the current reporting workflow

Define required metrics and zone structure

Identify the available data sources

Build the upload and validation path

Build the overview dashboard

Add core analytics views

Add management reporting

Deploy the first usable version

Document next-phase options

Usually later

What should usually wait

These can become useful later phases once the core reporting workflow, metric definitions, and data quality are stable enough to support them.

Real-time POS integrationsPredictive forecastingComplex staffing optimizationMulti-location benchmarkingAdvanced billingNative mobile appsLive alerting across multiple venuesDeep external integrations

Technical approach

Build around deterministic metrics, validated data, and reusable venue structure.

  • Define the operational model before choosing charts.
  • Give every metric a clear and consistent definition.
  • Keep calculations deterministic and reviewable.
  • Validate uploaded data before it reaches reporting views.
  • Use a reusable zone model across overview and analysis screens.
  • Add role-aware reporting when different teams need different visibility.
  • Handle operational data with explicit security boundaries.
  • Keep report generation audit-friendly.
  • Use a maintainable dashboard architecture.
  • Render dense tables and charts with performance in mind.

Next step

Need a clearer venue reporting or operational analytics workflow?

Start with the current exports, zone structure, recurring reports, and the decisions management needs to make.